Estimated 1RM
The heaviest single you could lift — estimated from any hard set, so you never have to test a true max.
Your one-rep max is the reference number for strength. Testing it for real is slow, fatiguing, and a good way to get hurt — so Powerhaus estimates it from any hard working set using the Epley formula. It’s accurate in the rep ranges you actually train, and we cap it so a high-rep set can’t produce a fantasy number.
See it in the app
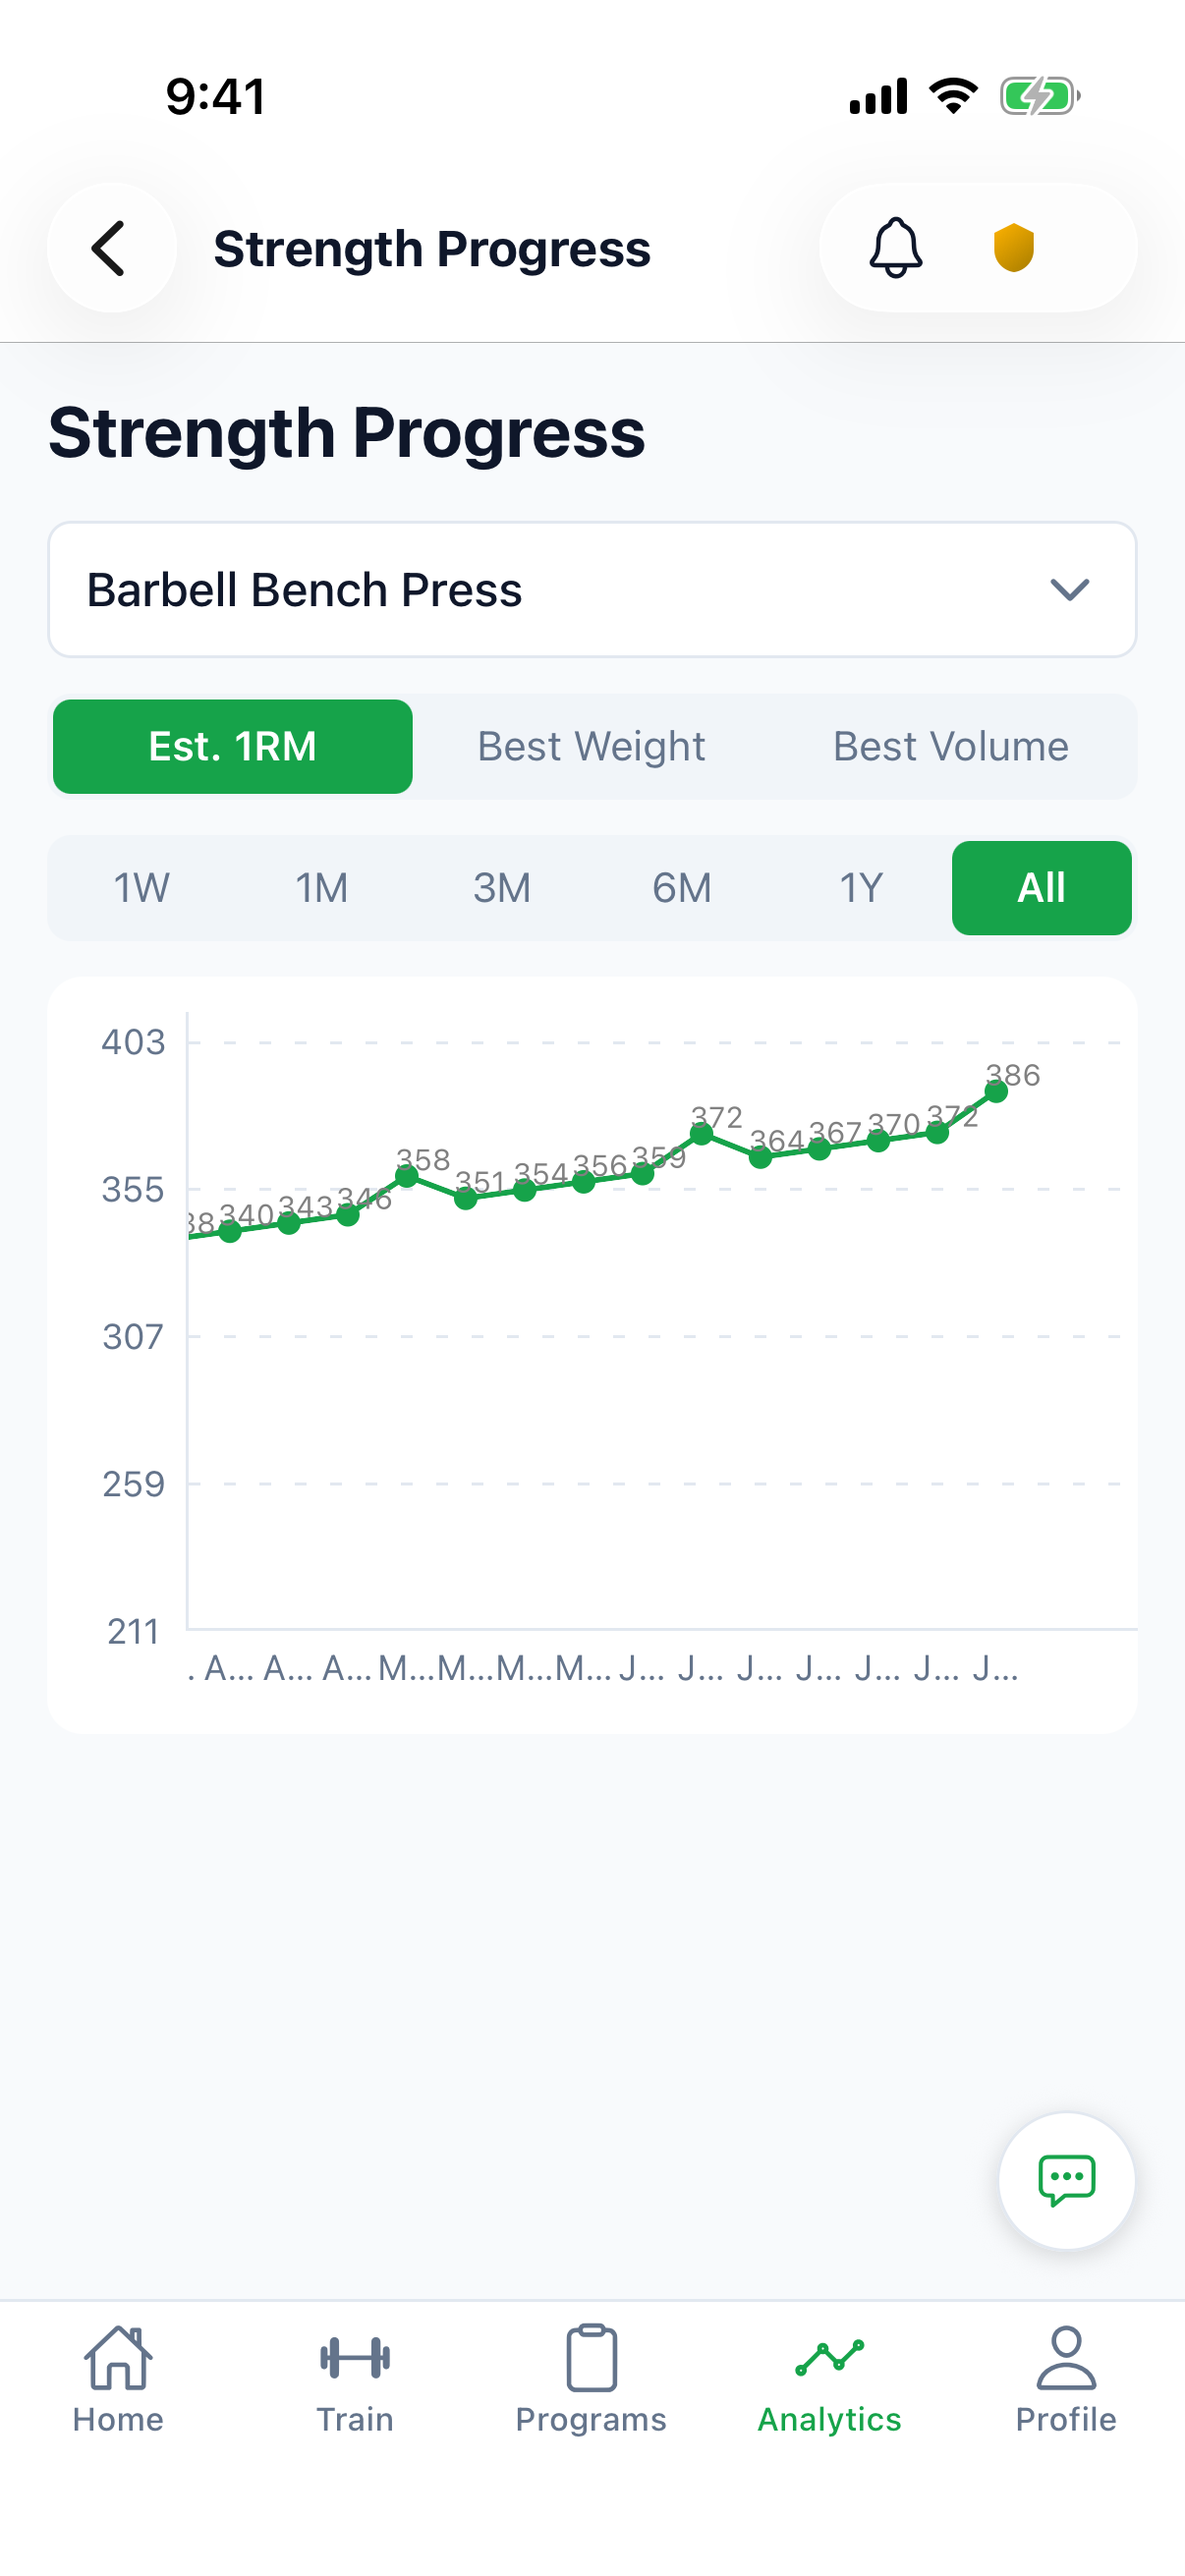
Open the Analytics tab
Tap Strength Trend (it opens the Strength Progress screen)
Select an exercise you’ve been training
Set the metric toggle to Est. 1RM — the chart plots it across every session
Even this is in Bronze — the whole tracker is $1/mo, and nothing here is locked behind a higher tier.
Why it matters
Your 1RM is the yardstick. It sets your training percentages, it’s how you compare a lift to last month, and it’s the cleanest single measure of “am I getting stronger.”
But maxing out every session is a bad idea — it’s exhausting, it eats recovery, and it raises injury risk. Estimating your 1RM from the normal sets you were already going to do means you get that yardstick automatically, every time you train, and get to watch it climb.
How Powerhaus calculates it
We use the Epley formula: your estimated 1RM is the weight on the bar multiplied by `(1 + reps / 30)`. A true single (1 rep) just returns the weight itself — no inflation.
Above 12 reps we clamp the estimate. Past that point the math stops being trustworthy (more on that below), so we’d rather show you a slightly conservative number than a fantasy one.
The science
Every 1RM formula — Epley, Brzycki, Lombardi, Wathan — is fitting the same underlying curve: the relationship between the percentage of your max on the bar and how many reps you can grind out near failure. They only differ in curve shape.
In the 1–10 rep range where almost all real working sets live, no formula meaningfully beats another — LeSuer et al. (1997) tested seven equations against measured maxes and found no equation meaningfully more accurate than another, Epley included. That’s the whole reason we picked Epley and don’t bother you with a formula chooser: in the band you train, the choice barely moves the number.
Accuracy falls off as the reps climb. Reynolds et al. (2006) measured prediction accuracy dropping from a 5-rep set to a 10-rep set to a 20-rep set, and Mayhew et al. (2008) confirmed equations are most accurate from sets under 10 reps. Beyond ~10 reps your limiter shifts from raw force to endurance, breathing, and grip — things a strength formula can’t model. That’s why NASM tests at no more than ~10 reps, and why we cap the input.