Training Load (ACWR)
Compares your recent training load to your longer-term baseline — a well-known sports-science idea we ship with its warning label fully intact.
ACWR — the acute:chronic workload ratio — divides your last 7 days of training volume by your last 28, so a number near 1.0 means “recent load looks like your baseline” and a big spike means you ramped up fast. It’s a famous team-sport metric, and we compute it faithfully over fixed calendar days so a jump in how often you train shows up honestly. We also keep its warning label on: this framework is contested, and it has essentially never been validated for lifting.
See it in the app
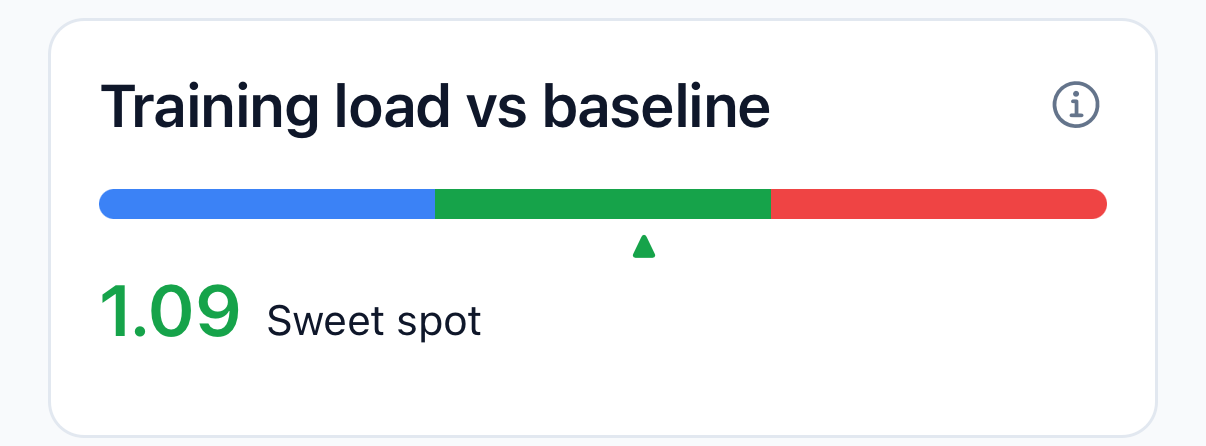
Open the Analytics tab
Scroll to Advanced — Gold (the Training Intelligence suite)
Tap the Training Load card
The gauge shows your acute:chronic ratio with its educational band and caveat
Part of the Gold Training Intelligence suite — the deeper analytics layer for lifters who want the full picture.
Why it matters
Big, sudden jumps in training load are worth noticing — ramping up much faster than your body is used to is a plausible way to dig a fatigue hole. ACWR is one lens on “am I spiking my load or building it steadily.”
Because it compares you to your own recent baseline, it adapts as you get fitter — the question it asks is always “is this a lot for me, right now,” not “is this a lot in the abstract.”
How Powerhaus calculates it
Acute load is your average daily training volume over the last 7 calendar days; chronic load is the average over the last 28. ACWR is acute ÷ chronic.
We average over fixed calendar days — not just the days you trained — on purpose. That way, if your training frequency spikes (say you go from lifting once a week to every day), the ratio actually climbs to reflect it, instead of quietly cancelling the change out.
The app keeps a wide informational band — roughly 0.8–1.5 reads as steady. Below 0.8 it reads as a detraining dip, and it only flags a spike above 1.5, to inform rather than alarm. The tightest, highest-confidence research window is actually a bit narrower (0.8–1.3).
The science
ACWR comes from team and collision sports — not the weight room. It was developed and validated almost entirely in sports like soccer and rugby (Science for Sport overview). Its 0.8–1.3 “sweet spot” and >1.5 danger zone are the most-cited numbers in that world.
The framework is under a serious, sustained critique — and you deserve to know it. Researchers have shown that because the recent window is inside the long-term window, the two are mathematically coupled (Lolli et al., 2019); one analysis found that substituting random numbers for the chronic load predicted injury about as well as the real thing, implying the ratio carries far less information than it appears to (Impellizzeri et al., 2020).
For lifting specifically, the evidence is essentially absent. A 2025 systematic review of ACWR and injury found zero qualifying resistance-training studies — the entire evidence base is other sports (2025 review). This is exactly why we surface ACWR as a low-confidence, non-blocking signal with its caveats attached, never as a health verdict.
Sources
- Science for Sport — ACWR overview and its team-sport origins
- Lolli et al. (2019), BJSM — spurious mathematical coupling in ACWR
- Impellizzeri et al. (2020) — random numbers predicted injury about as well as real ACWR
- 2025 systematic review — zero qualifying resistance-training studies
- Maupin et al. (2020) — ACWR & injury sweet-spot literature